Upgraded global COVID-19 Dashboard puts local epidemic information at your fingertips
Publicsh Date:2021.06.23

The homepage of COVID-19 dashboard
The NCHC of the NARLabs built a "COVID-19 dashboard" in March, 2020, with data feeds from the Johns Hopkins University and Taiwan's Ministry of Health and Welfare. The map helps the public see the latest developments in the pandemic and allow researchers use the consolidated source data on the website to create more value. The functions of this information service continue to improve with the changing needs of the pandemic, including index for lifting restrictions, vaccine information, and the distribution map of confirmed cases across Taiwan. It also serves to remind users to be vigilant in order to keep the virus at bay.

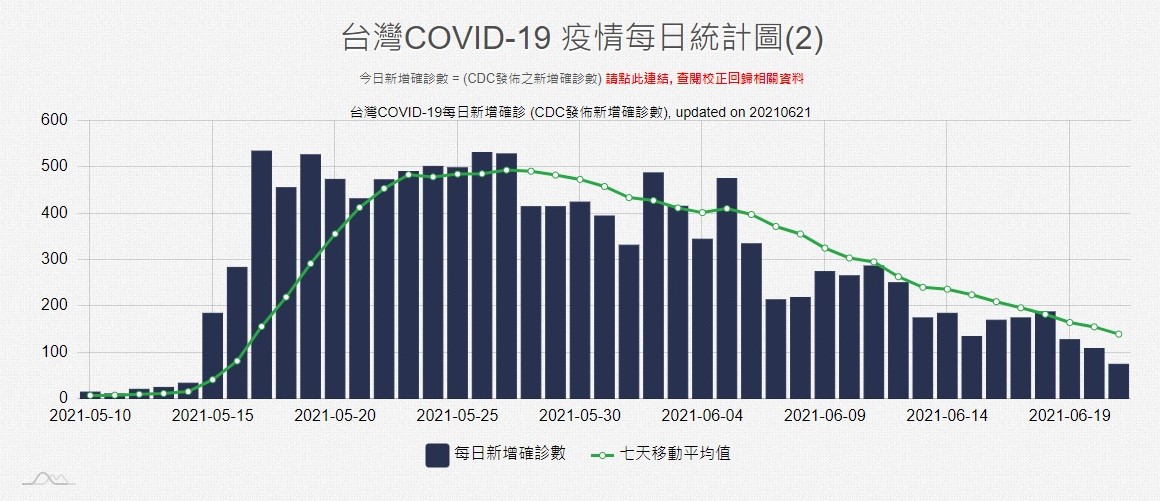
Although Taiwan experienced a peak of confirmed cases from May to June, it can be seen from the graph that cases were gradually decreasing.
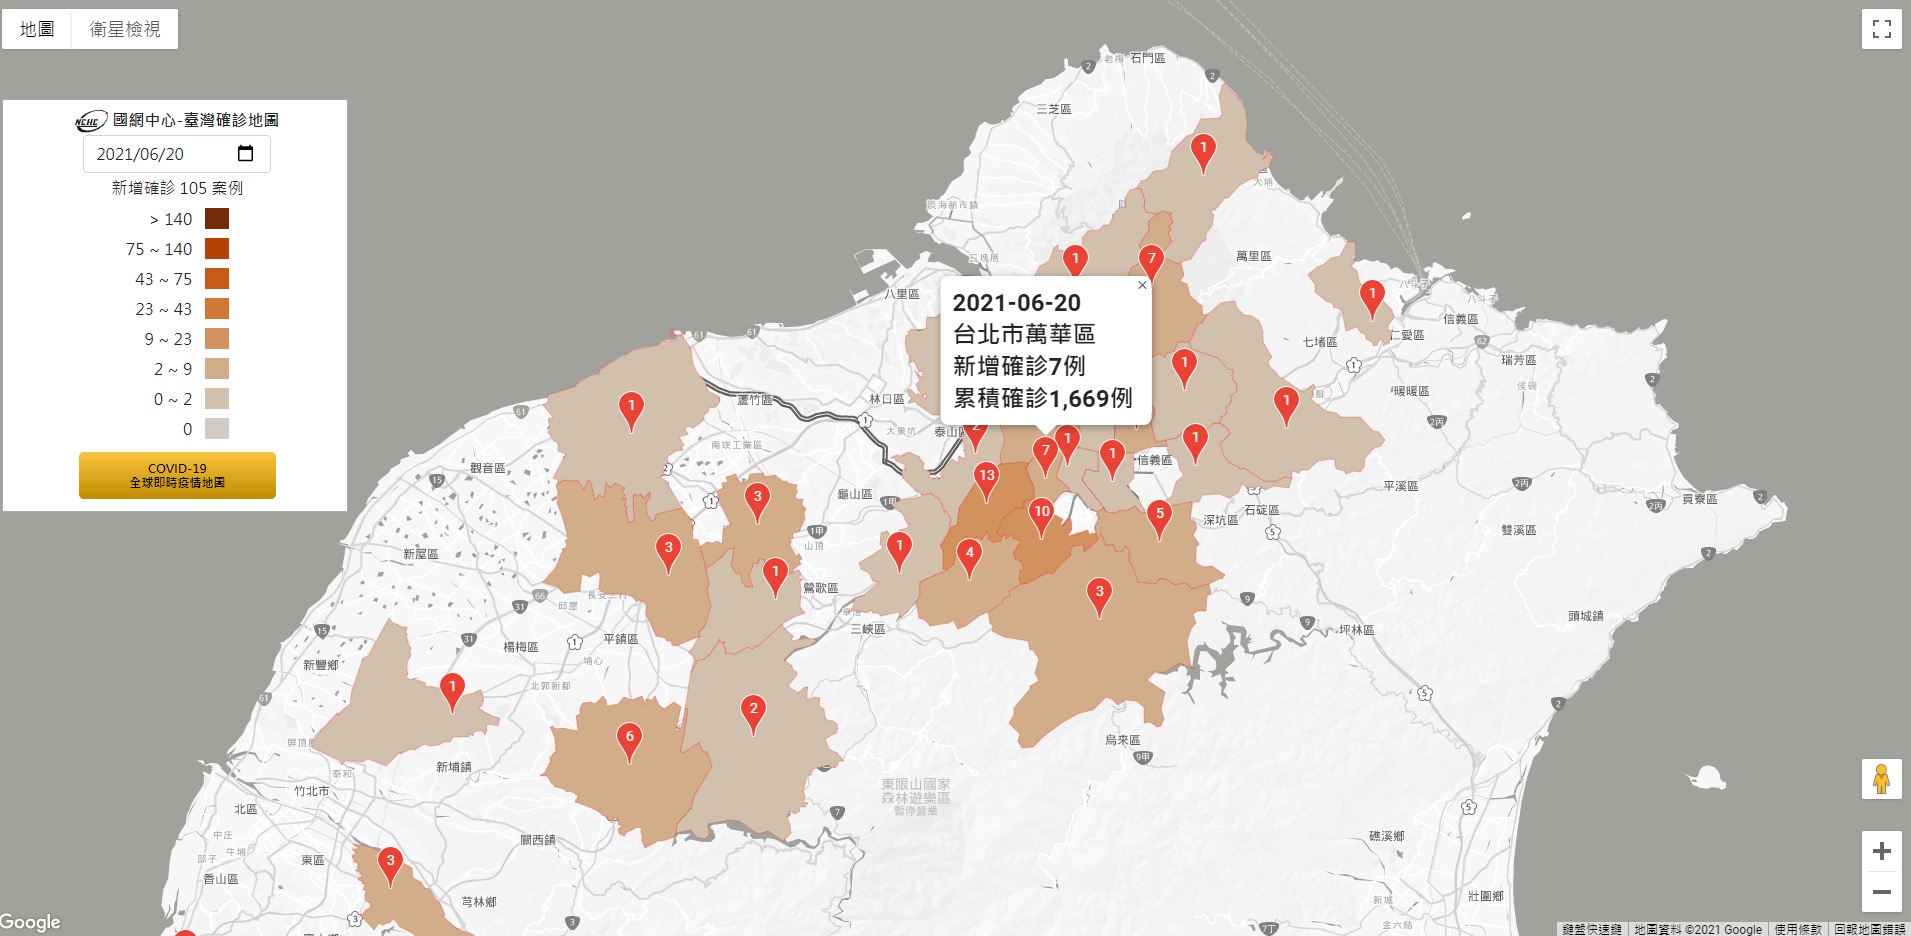
Along with the variation of the pandemic, the NCHC has also further upgraded the functions of this platform, including the progress in vaccination around the world and the distribution map of the confirmed cases by administrative region in Taiwan. People can use their own coordinate information, such as the IP address or mobile phone GPS tracker to check the number of confirmed cases in that location, which can be displayed dynamically in maps, numbers, or colors, providing real-time information of that administrative region. It also serves to remind users to be vigilant in order to keep the virus at bay.

Through the combination of information from the CDC and geographic information, the public can quickly grasp the status of the pandemic in various counties and cities.
The analysis chart of confirmed cases in Taiwan's counties and cities was launched in mid-June. The public can see in these charts confirmed cases trend analysis for each administrative district of each region. People who are interested in the development of the domestic pandemic can keep abreast of the latest development of the pandemic, and the original source data from the website are available for interested researchers to add value.
For more information, please go to the COVID-19 Dashboard website of the NCHC: https://covid-19.nchc.org.tw/index.php
 國家高速網路與計算中心
