 National Center for High-performance Computing
Scientific Visualization
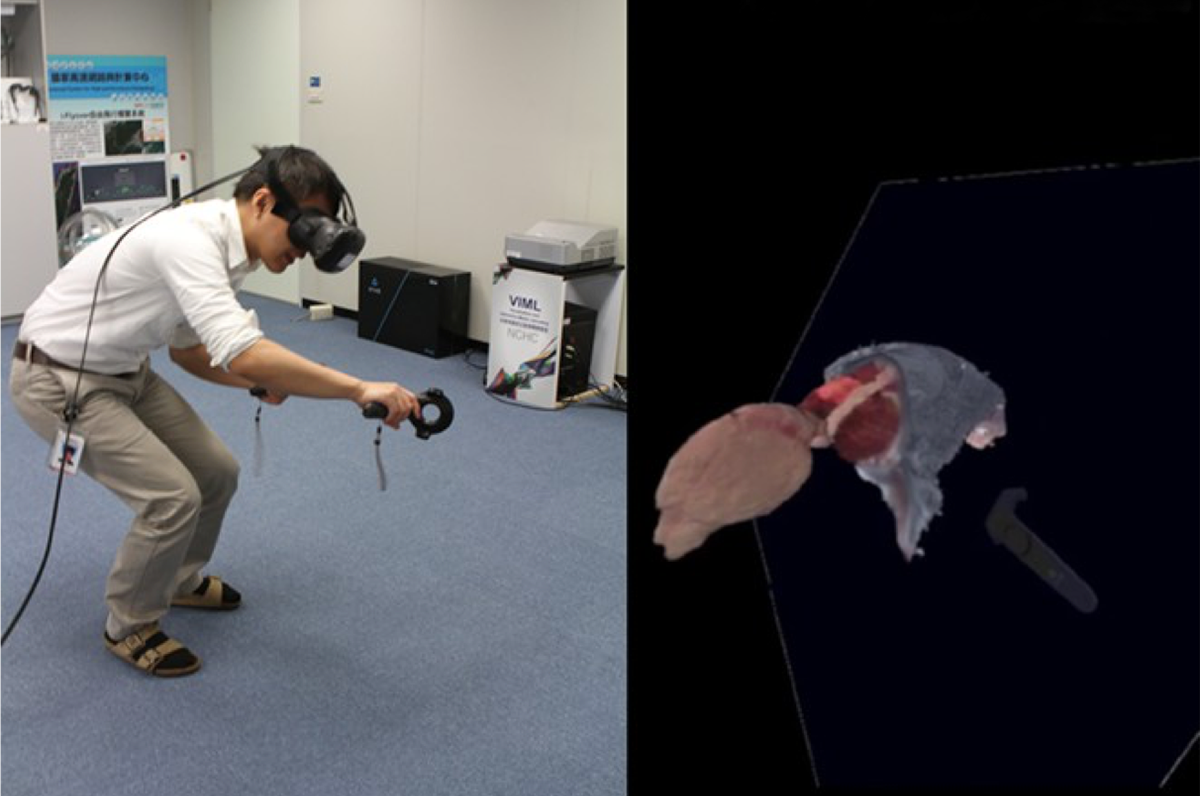
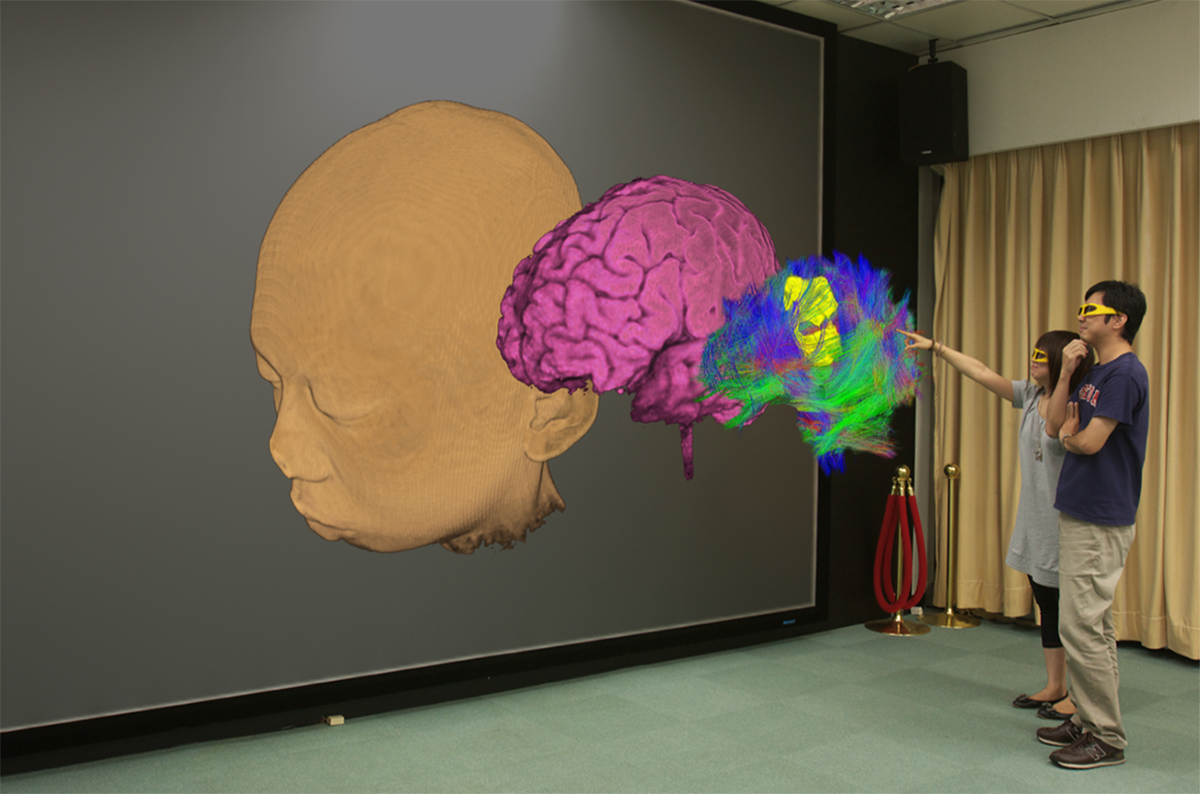
Scientific visualization is the representation of data graphically using 2D images or 3D model animations, as a means of gaining understanding and insight into the data. It is also known as visual data analysis. The Visualization and Interactive Media Laboratory (vimL) at NCHC serves the national research institutes and industries. Through the projects and contracts of industrial services, we deliver consultation support, image and graphical software, and VR/AR applications that help scientists to see the unseen. Currently, we serve various domains of studies such as bio-medical image analysis and visualization, GIS navigation system, engineering/scientific simulation, and large data and information visualization.
Large Data and Information Visualization
3D motion picture
VIML Website(new window)
Contact Person:Mr. Chang
0103115@narlabs.org.tw
Large Data and Information Visualization
3D motion picture
VIML Website(new window)
Contact Person:Mr. Chang
0103115@narlabs.org.tw